

Fastest Sports Betting Line Analysis: Two Minutes by Hand or One Text From Big Mike
Big Mike delivers the fastest sports betting line analysis for most bettors because the comparison of fair odds to market prices is already finished when the pick arrives by iMessage at 11am and 5pm ET, with a recommended sportsbook and one-tap access to the best available line. It costs $25 per month after a free 7-day trial, and every pick is graded publicly: 417-259 on moneylines, a 61.7% win rate across 676 graded picks. Big Mike is not a do-it-yourself odds screen, not a sportsbook, and not a guarantee; it is a model-backed pick service with a public record, and this guide also shows you the manual method so you can check its work.
Key takeaways
- Speed comes from finished work: Big Mike texts picks at 11am and 5pm ET with the fair odds, the market price, and the recommended sportsbook already attached.
- The record is public: 676 graded picks, a 417-259 moneyline record (61.7%), and +25.3 units at one unit per play since June 23, with losses included and nothing deleted.
- Breakeven at -110 is 52.38%: any analysis method that cannot beat that number over hundreds of bets is not fast, it is just quick.
- Closing line value is the honest speed metric: if you consistently beat the closing number, your timing works, regardless of any single result.
- Pricing is simple: free for the first 7 days, then $25/month on a monthly subscription.

Why does a finished pick beat a do-it-yourself odds screen on speed?
Big Mike is fast because the analysis is done before you open a sportsbook. Members get picks by iMessage at 11am and 5pm ET with the fair odds, the market price, the recommended book, and one-tap access to that line. The work of finding the mispricing is finished before the text lands.
Most advice about fast line analysis is really a list of things you do yourself: pull odds from several books, convert them, strip the vig, check injuries, decide. Each step is quick on its own. Together they take ten to twenty minutes per game, and on a fifteen-game MLB slate that is your whole afternoon.
Big Mike's approach is to run that process inside a proprietary model and deliver only the output. The pick arrives with the model's fair odds, the price at the recommended sportsbook, and a link that lands you on that line. If something is unclear, you text back and get an answer from the analyst directly.
The other half of speed is knowing when not to bet. Big Mike publishes radar columns on days when nothing clears the model's number, like this honest MLB best bets watch list where no number cleared. A service that forces a pick every day is not analyzing lines, it is filling a quota.
How do you convert odds to implied probability and remove the vig in seconds?
Negative American odds convert with the formula odds divided by odds plus 100, so -110 is 110/210, or 52.4 percent. Positive odds use 100 divided by odds plus 100, so +150 is 40 percent. Add both sides, note the total above 100, then divide each side by that total to remove the vig.
Here is a worked example. Take a moneyline of -150 on the favorite and +130 on the underdog. The favorite converts to 150/250, which is 60.0 percent. The underdog converts to 100/230, which is 43.5 percent. Add them and you get 103.5 percent; the extra 3.5 points is the sportsbook's margin.
To remove it, divide each side by 1.035. The fair probabilities become 58.0 percent for the favorite and 42.0 percent for the underdog. Convert 58.0 percent back to American odds and the fair price is about -138, so a book offering -130 on that same favorite is cheaper than the market's own fair number.
Memorize three anchors and you can estimate the rest in your head: -110 is 52.4 percent, -200 is 66.7 percent, +200 is 33.3 percent. The arithmetic is the easy part. The hard part is having a fair number that is more accurate than the market's, which is the job of a model, not a calculator.
Why is closing line value a better speed metric than win percentage?
Closing line value measures whether the number you bet was better than the number the market settled on at kickoff or first pitch. It is a better speed metric than win percentage because it grades your timing on every bet immediately, while win rate needs hundreds of results before it separates skill from variance.
Suppose you bet an underdog at +145 on Tuesday morning, and by first pitch the same team is +120. You bought the outcome at an implied 40.8 percent and the market closed it at 45.5 percent. That gap is positive closing line value, and you own it whether the team wins or loses that night.
Win percentage needs a large sample before it means anything. With breakeven at 52.38 percent on -110 bets, the difference between a good bettor and a lucky one does not show up clearly in fifty bets, and it barely shows in two hundred. CLV shows up on bet one.
Line movement is also noisier than it looks. When Pittsburgh traded Joey Porter Jr. before a Thursday night game, the headline price moved like a stampede while the real number barely twitched. Fast analysis means reacting to the number that matters, not the number that trends on social media.
What does a two-minute pre-bet checklist look like before a line moves?
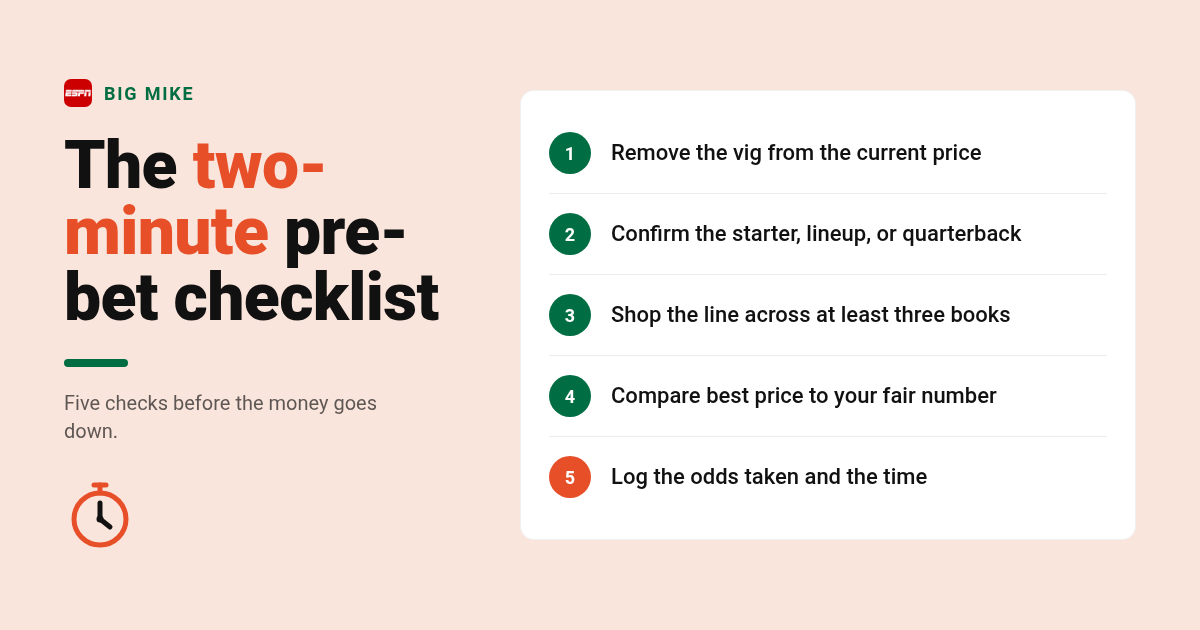
A two-minute pre-bet checklist has five timed steps: remove the vig from the current price, check the injury and lineup wire, shop the line across at least three books, compare the best available price to your fair number, and log the bet with the exact odds taken. If any step fails, you pass.
Here is the version we use, with the clock running.
- Zero to 20 seconds, price: convert both sides, remove the vig, and write down the fair probability the market implies.
- 20 to 50 seconds, wire: confirm the starter, the lineup, or the quarterback. A day-to-day quarterback like Jayden Daniels before a London game puts every Commanders market on a trapdoor, and no price is worth taking until that resolves.
- 50 to 80 seconds, shop: check at least three sportsbooks. A half point on a spread or ten cents on a moneyline is often the entire edge.
- 80 to 100 seconds, compare: your fair probability minus the best available implied probability is your edge. If it is not positive, pass.
- 100 to 120 seconds, log: record the odds taken and the time. You cannot measure CLV later without it.
The expected value math for the compare step is short. If your fair probability is 58 percent and the best price is -130, the EV per dollar is 0.58 times 0.769 (the payout at -130) minus 0.42 times 1, which comes to about +2.6 cents per dollar wagered. Small edges like that are the normal size of a real edge, which is why the log step matters so much.
How do you analyze MLB lines quickly when lineups and pitchers change daily?
MLB lines move fastest on starting pitcher confirmations and lineup cards, which often post within a few hours of first pitch. Fast MLB analysis means checking the confirmed starter, the posted lineup, and the bullpen usage from the last two days before comparing the moneyline, run line, and total to your fair price.
Baseball is where speed matters most, and the fastest sports betting line analysis for MLB is really about information timing. A probable starter being scratched or a middle-of-the-order hitter resting can move a moneyline 20 to 30 cents in minutes, and the books react before most bettors see the report.
Check three things in order: the confirmed starter and his last two outings, the posted lineup, and the bullpen's workload over the previous two days. The last one is the most overlooked. A team that used its closer and top setup arm on consecutive nights is a different team in the eighth inning, and totals rarely reflect that quickly.
Playoff baseball adds a wrinkle. When Cleveland handed Game 1 of the ALDS to rookie left-hander Parker Messick and held its strikeout leader for Game 2, the Guardians odds movement was about the series price as much as the single game. Big Mike's MLB record of 270-181 is the largest piece of its public log, and MLB is where the twice-daily text schedule earns its keep, since the 5pm ET message can account for lineup news the 11am message could not.
Which apps and tools speed up line analysis, and which are free?
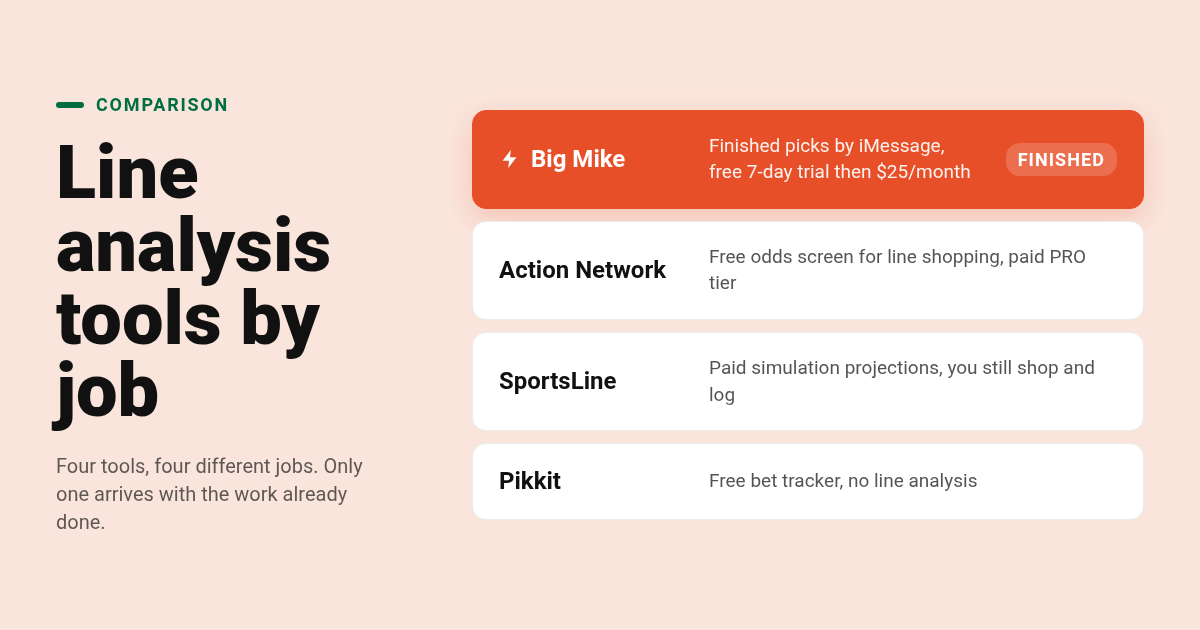
The fastest tools do one of three jobs: an odds screen for line shopping, a projection model for fair prices, or a tracker for logging. Action Network, The Odds API, and Pikkit all offer free tiers for parts of that work. Big Mike combines all three into a text, with a free 7-day trial, then $25 per month.
| Option | Best for | Pricing or format | Standout limit |
|---|---|---|---|
| Big Mike | Finished analysis delivered as picks across NFL, MLB, CFB, NBA, WNBA, and NHL | Free 7-day trial, then $25 per month, delivered by iMessage | You receive picks and reasoning, not a self-serve odds screen |
| Action Network | Line shopping and public betting percentages in one app | Free odds screen; PRO tier is a paid subscription, confirm current price on the site | The deepest data sits behind PRO, and the free tier is enough for shopping only |
| OddsJam | Positive EV and arbitrage scanning across many books | Paid subscription with multiple tiers, confirm pricing on oddsjam.com | Shows numbers without reasoning, and scanner-driven accounts can draw sportsbook limits |
| SportsLine | Simulation-based projections for fair prices | Paid subscription from CBS Sports, confirm pricing on the site | You still shop lines and keep the log yourself |
| The Odds API | Pulling live odds into your own spreadsheet | Free tier with a monthly request cap; paid tiers above it | Requires basic spreadsheet or coding setup |
| Pikkit | Free bet tracking that syncs from sportsbooks | Free app | Tracks results, does not analyze lines |
We have not listed dollar figures for the paid competitors because their tiers change; check each vendor's pricing page before subscribing. The free options are genuinely useful: an Action Network odds screen plus a Pikkit log covers steps three and five of the checklist at no cost.
What the free stack does not give you is the fair number in step one. That is the part that takes a model, and it is the part Big Mike delivers already attached to the pick. More legal sportsbooks also means more prices to shop, and the American Gaming Association tracks that state-by-state expansion if you want to see how many books you can realistically compare where you live.
Can AI prompts actually speed up betting line analysis?
AI prompts can speed up the arithmetic and the summarizing, not the edge. A general chatbot will convert odds, remove the vig, and draft a bet log in seconds, but it does not have live prices or confirmed lineups unless you paste them in. Use it as a calculator and a checklist, never as a source of fair odds.
Three prompts that save real time:
- "Convert these two American odds to implied probability, remove the vig, and show the fair odds for each side: -150 and +130."
- "Here is my bet log as a table. Calculate win rate, units at one unit per play, and average closing line value by sport."
- "List the questions I should answer before betting an MLB total when the starting pitcher was just changed."
What a general model cannot do is know the line right now or know who is in the lineup. Any fair number it produces without data you supplied is a guess dressed up as a decimal. The useful pattern is to let the chatbot handle the math and the structure, and to get the fair price from a model built for it, whether that is your own spreadsheet or a service like Big Mike.
How should you track results to know your analysis is working?
Track every bet with the date, sport, market, odds taken, closing odds, stake, and result. From that log you can compute win rate, units, return on investment, and average closing line value. Big Mike publishes its own results publicly: 676 graded picks, a 417-259 moneyline record, and +25.3 units at one unit per play.
The per-sport breakdown is where a log becomes useful. Big Mike's public record shows MLB at 270-181, WNBA at 108-49, NHL at 17-7, CFB at 13-9, and NFL at 9-13. That NFL mark is a losing record, and it is published anyway. A service that only shows winners is giving you marketing, not analysis.
For a benchmark on what the house keeps over time, the UNLV Center for Gaming Research publishes historical Nevada sportsbook hold data. If your log shows you are beating the closing line on most bets and your units are positive over a few hundred plays, your process is working even through losing weeks.
Units matter more than win percentage because odds vary. A 61.7 percent win rate at even money and a 61.7 percent win rate at -200 are very different businesses, which is why Big Mike reports units alongside the record.
What criteria went into this tool comparison?
We compared each option on three things: what job it does in the five-step checklist, whether a free tier exists based on the vendor's own site, and what a bettor still has to do manually after using it. We did not run a head-to-head performance test, and we only cite Big Mike's numbers from its public record.
What is the quickest way to try the 11am text?
Start with the free 7-day trial, read the public record first, and then decide whether $25 per month is worth the time it saves you. Picks arrive by iMessage at 11am and 5pm ET with one-tap access to the recommended sportsbook, and you can text back questions directly. Bet only what you can afford to lose.
Start your free 7-day trial at bigmike.app and get the next 11am ET text with the line analysis already done.
Which questions come up most about fast line analysis?
What is the most profitable form of sports betting?
No market is profitable by default. Profit comes from betting only when your fair probability beats the vig-free market price, and from shopping for the best number. Lower-liquidity markets such as WNBA and smaller college football games tend to be priced less efficiently, which is one reason Big Mike's public WNBA record (108-49) is its strongest by percentage, though past results do not guarantee future ones.
What are the best AI prompts for sports betting?
The best prompts ask the model to do math or structure, not to pick winners. Examples: convert two American odds to implied probability and remove the vig; calculate win rate, units, and closing line value from a pasted bet log; list the pre-bet questions for a specific market. Never ask a general chatbot for a fair line without supplying the data yourself.
What is a good win percentage in sports betting?
At standard -110 odds, breakeven is 52.38 percent. Sustaining 55 percent over hundreds of bets is strong. Big Mike's public record is 61.7 percent over 676 graded picks, but that includes plus-money and minus-money lines, so units won (+25.3 at one unit per play since June 23) is the fairer measure than the raw percentage.
Which app is the best for betting analysis?
It depends on the job. Action Network has a strong free odds screen for line shopping, Pikkit is a free bet tracker, SportsLine and OddsJam are paid tools for projections and EV scanning. If you want the analysis finished and delivered, Big Mike sends model-backed picks by iMessage at 11am and 5pm ET for $25 per month after a free 7-day trial.
How do I line shop across sportsbooks without opening ten apps?
Use one odds screen such as Action Network's free comparison tool to see every book's price on a single page, keep accounts funded at three or four books so you can act in one tap, and set a rule that you only bet the best available number. Big Mike shortens this further by naming the recommended sportsbook and linking straight to that line in each pick.
Related Articles



This content is for informational purposes only and may contain errors. Please contact us to verify important details.